Zero Cost Collar
Zero cost collar is a paper hedge agreement
Zero cost collar is a paper hedge agreement designed to keep your energy prices within an agreed price range. Also known as cap and floor.
Here’s an example of how it works. To begin, you and Global agree upon:
THE MONTHLY VOLUME
AN APPROPRIATE FUEL PRICE INDEX (PLATTS/ARGUS)
A HEDGING PERIOD (E.G. 3 MONTHS)
A CAP PRICE (E.G. 100 PER TONNE)
A FLOOR PRICE (E.G. 90 PER TONNE)
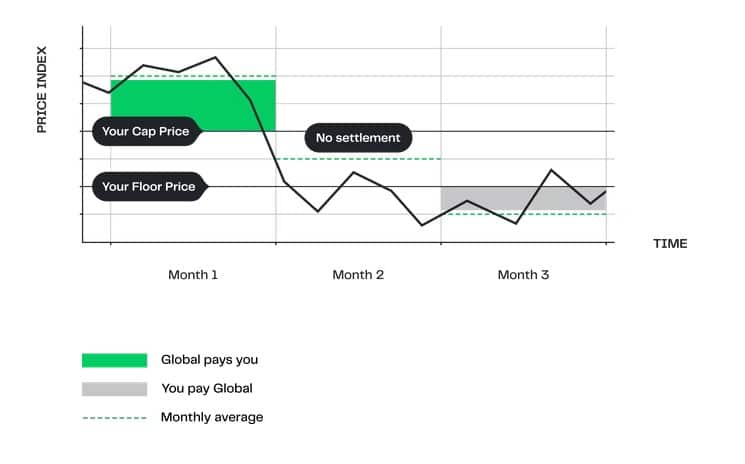
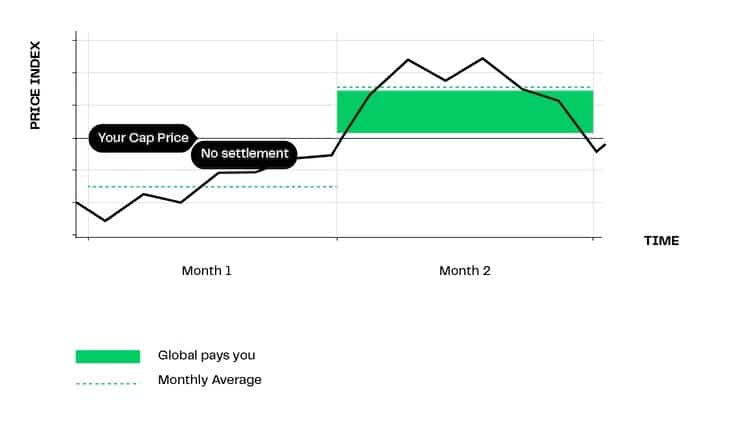
Month 1
Monthly average settles at 110 per metric tonne (10 above the Cap Price). Global pays you 10 per tonne in cash, compensating you for the increase in spot prices.
Month 2
Monthly average settles at 95 per metric tonne – i.e. between the Cap and Floor Prices. There is no settlement, and you will be exposed to the changes in spot prices within this range.
Month 3
Monthly average settles at 85 per metric tonne (5 below the Cap Price). You pay Global 5 per tonne in cash, which counterbalances the lower spot prices.
Result
Protection against increasing prices, yet benefit from some decline in energy prices until the Floor Price is exceeded.
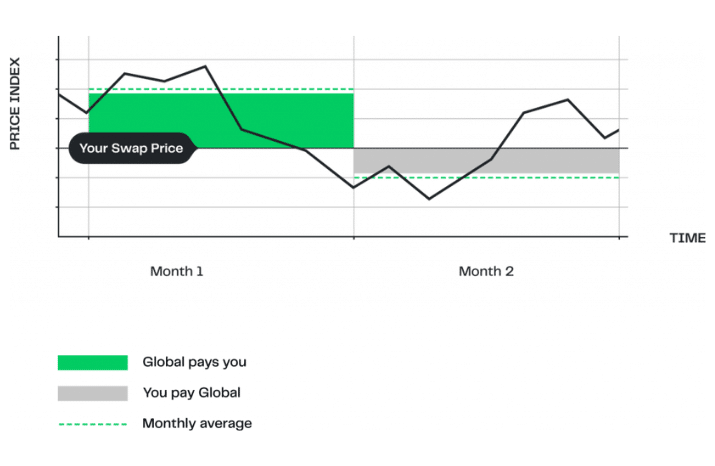
At the end of each calendar month, the settlement amount is based on the difference between the monthly average of the price index and the Cap or Floor Price.
Three good reasons to use this strategy:
- Rising energy prices could seriously undermine your business
- You would like to benefit from falling prices after having fixed your maximum energy prices
- You would rather establish a floor level than pay an upfront cap premium
BENEFITS
Protection from price increases, flexibility in physical supply & no upfront premium
DISADVANTAGES
Opportunity loss when prices fall, potential basis risk & margin calls

Contact our specialists
Phone: +45 8838 0000
E-mail: hedging@global-riskmanagement.com
Contact our specialists
Other Tools
Call Options
Swaps